- 19.2% of BC residents in 2004 were clinically obese. [(I)nferential]
- Of the children and adolescents studied in the 2004 Canadian Community Health Survey, 8% were clinically obese. [(D)escriptive]
- About 90% of students in our MATH108 class are nursing students. [(D)escriptive]
- 30.1% of male registered nurses (RNs) are under the age of 40. [(I)nferential]
- Whether a student passes a course or not [(G) Categorical]
- How many children are in a family [(D)iscrete]
- Satisfaction with current family doctor, rated as "Very Dissatisfied", "Dissatisfied", "Satisfied", or "Very Satisfied" [(O)rdinal]
- Hemoglobin count, in g/dL [(C)ontinuous]
- Age, divided into categories "0-10", "11-18", "19-25", "26-39", "40-59", "60 and up" [(O)rdinal]
- What fraction of Conservatives in this town drive large trucks?
[3]
Let C = Conservative, T = drives a large truck.
P(T|C) = P(T and C) / P(C) = .27 / .63 = 3/7 ≈ 42.85%. - In this town, is voting Conservative independent of driving a
large truck? Why or why not? Interpret what this means in the context
of the townspeople.[3]
P(T|C) = 3/7 = P(T), so the two events are independent.In words, if we narrow our focus to Conservatives, we see that 3/7 of Conservatives drive large trucks. So we see that it doesn't matter whether a townsperson is Conservative or not, the chance of driving a large truck is still the same.
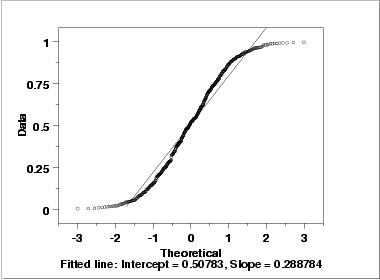
[NIST Engineering Statistics Handbook, §1.4.2.2.2]
[Compared with a normal distribution, both tails have been pushed inward, increasing the density in the mid-section. (The underlying distribution in this case was actually uniform, with equal probability for all values between 0 and 1.)]
4.1, 5.7, 4.7, 3.2, 4.2, 2.8, 3.6, 5.3, 4.2
- Construct a relative frequency histogram, classifying the data by bins of width 1 mg/dL.[4]
- Find the sample mean. Show your work. [2] [4.2 mg/dL]
- Find the sample standard deviation. Show your work. [4] [0.9381 mg/dL]
- Draw a boxplot for the data. Show your work. [4]
[min=2.8, Q1=3.4, med=4.2, Q3=5.0, max=5.7] - Find a 95% confidence interval for the average total serum bilirubin
level for this baby over the one-month period. [4]
[SE=0.3127, df=8, t=2.31, conf int = (3.48, 4.92)] - Interpret this confidence interval in words and in the context of the
study. [2]
[We are 95% confident that the average total serum bilirubin for this baby during this period lies somewhere between 3.48 and 4.92 mg/dL.] - We feel this confidence interval is still too broad.
In order to estimate the average total serum bilirubin level
to within ±0.4 mg/dL with 90% confidence, how many measurements
would we need to average? (Assume the underlying true bilirubin level
does not change.) [4]
[z=1.65, n = 14.91, round up to 15 measurements.] - If we increase the sample size to n=40 measurements, would we expect
the distribution of our sample to be more normal? Why or why not?
[2]
[No, the distribution of the sample follows the distribution of the population, which does not change with sample size.]
- What is the probability that this assay returns a result within
±2.5 mmol/L of the true value? [2]
[z = ±2.5/2 = ±1.25, area = 78.88%] - If the true concentration of blood lactate in a patient is 18.3 mmol/L
(not "high"), what is the probability that the assay could still return a
value that is considered "high"? [2]
[z = (20-18.3)/2 = 0.85, area to the right = 1 - 0.8023 = 19.77%] - Since the assay is so imprecise, we run it five times and average the
results. Using the same true concentration of 18.3 mmol/L, what is the
probability that the average of five runs is still "high"? [4]
[SE = 2/sqrt(5) = 0.8944, z = (20-18.3)/0.8944 = 1.90, area to the right = 1 - 0.9713 = 2.87%]
- Suppose the test is applied to a group of patients, 40% of whom are
known to have colon cancer.
Draw an event tree for the outcomes of the test. Label the tree
with probabilities for each branch. Also calculate the probabilities of each
final outcome (leaf of the tree). [5]
[(CA,+):37.2%. (CA,-):2.8%. (noCA,+):6.6%. (noCA,-):53.4%] - What is the probability that a random patient from this group will
test positive for colon cancer using this screening test?[2]
[37.2% + 6.6% = 43.8%] - What is the probability that a patient from this group who tested positive
actually has the disease? [2]
[37.2% / 43.8% = 84.93%]
- What is the population in question? [1] [Nurses (everywhere)]
- List the variables which need to be measured. [1]
[Gender and whether the nurse quits within the first five years.] - For each variable, indicate its level of measurement and whether
it is a predictor (independent variable) or outcome
(dependent variable). [2]
[Gender: categorical/dichotomous, predictor.
Quitting: categorical/dichotomous, outcome] - Discuss how you might do the sampling process. What are some
steps you could take to ensure a random sampling? Address both criteria for
random sampling. How would you measure the variables? Would the
measurement process bias your sampling? [3]
[Employment records from hospitals/clinics: find all nurses who quit within five years, and all nurses who have been working as nurses for over five years. (Don't include nurses who have been working less than five years but haven't quit.)]